
Markov Pie
Markov Chain Visualization
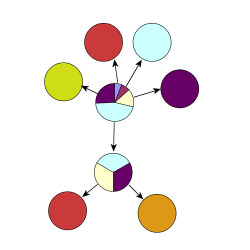
A Markov Chain is a finite state machine with sets of probabilities associated with each transition. They're often visualized with a directed graph where edge transitions are labeled with the associated probabilities.
I'm not sure if I should be ashamed to admit it, but I love pie charts. I think they're really effective means of conveying proportions and composition. I once suggested putting a pie chart in an ANOVA report to show SS distribution, and I distinctly remember the resident statistical advisor, a department chair at a big university, initial bristling at the thought, because I think he felt pie charts should be left to USA Today. Never had the time to do it, but after my defense he warmed up to the idea.
So, anyhow, the thought of the day is to render Markov Chains with states represented in the form of pie charts. I've intentionally left the transitional probabilities off the labels in an attempt to defend the utility of the pies. The size of the slice represents the size of the transitional proability.
graphical models / probabilistic networks: 1, 2, 3, 4
A Markov Chain is a finite state machine with sets of probabilities associated with each transition. They're often visualized with a directed graph where edge transitions are labeled with the associated probabilities.
I'm not sure if I should be ashamed to admit it, but I love pie charts. I think they're really effective means of conveying proportions and composition. I once suggested putting a pie chart in an ANOVA report to show SS distribution, and I distinctly remember the resident statistical advisor, a department chair at a big university, initial bristling at the thought, because I think he felt pie charts should be left to USA Today. Never had the time to do it, but after my defense he warmed up to the idea.
So, anyhow, the thought of the day is to render Markov Chains with states represented in the form of pie charts. I've intentionally left the transitional probabilities off the labels in an attempt to defend the utility of the pies. The size of the slice represents the size of the transitional proability.

graphical models / probabilistic networks: 1, 2, 3, 4
posted by metamerist at
8:42 AM
![]()

2 Comments:
Intriguing idea. One rumination I have is how you could match up the colors so that the color of a pie slice matched up with the color of the state it is transitioning to. For the leaf states this is fairly simple, but it's a little more complicated to layout for the other nodes. It's also more complicated if the transition is bidirectional. One possibility is to render bar charts inside of the circle instead of a pie chart, and draw the outline of the circle in the color assigned for that state.
Interesting thoughts, too. One of the motivations behind this is a better means of workflow/task visualization, to not only the steps possible in workflows but also the relative frequency of various steps.
Post a Comment
Subscribe to Post Comments [Atom]
<< Home