
Why the Bell Curve?
There seem to be countless times in my life where I've said, "I wish I would have known that a long time ago!" or "Why didn't you say so?!?!" More specifically, I'm refering to times when key insights came, insights crucial to understanding some concept. More often than not, the insights came in the form of an example showing a great underlying truth with undeniable clarity.
As a parent who spends too much time on the road, I often find myself thinking about good examples to offer my children, in hopes of sparing them painful paths from "I don't get it!" to "Why didn't you say so?!?!" As a stab (no promises) toward such an end, I'm writing this post.
In order to understand most things, I think you have to get your empirical hands dirty. I think it's hard to gain real understanding working purely in abstract terms (if you can avoid it). The way to get your hands dirty in this particular case is by playing Yahtzee, a game I believe most people have played at one time or another in their lives.
Yahtzee consists of 5 dice. After rolling the dice, one attempts to fulfill one of several possible objectives, most of which resemble poker hands (four of a kind, three of a kind, a full house, etc.) If you've played Yahtzee, you know that the most pleasing rolls are those that reveal the most sixes, because there are a number of objectives best fulfilled with lots of sixes.
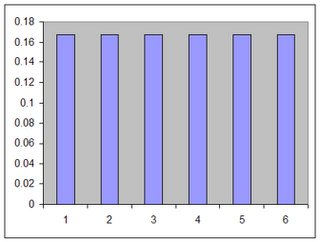
Here's a chart showing the chances of rolling 1, 2, 3, 4, 5 and 6 with a single die. If the die is fair and properly designed, the chance of each number is 1/6 (or 0.166666...). Notice that the chart is flat, which outcomes all numbers are equally likely.
Let's look at the possible sums resulting from rolling two dice. The two least likely sums are two and twelve. The reason is there's only one way to get those sums--you have to roll either 2 ones or 2 sixes. The chances of rolling either sum is 1/6 * 1/6, or 1/36. On the other hand, rolling a sum of seven is much easier, because there are so many combinations that add up to seven (1+6, 6+1, 2+5, 5+2, 3+4, 4+3).
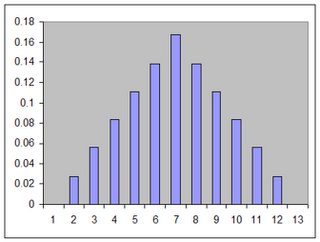
It's important to consider the shape of the chart going from one die to the sum of two dice. The first chart was flat, with all outcomes equally probable. The second chart looks like a tent; it's triangular, high in the middle where sums are most likely and short at each end where sums are least likely.
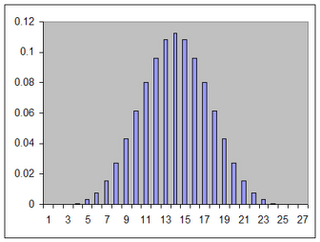
Let's move on to three dice. Again, we'll look at the possible sums of all dice and the odds of getting those sums. The smallest possible sum is 3. To get it, you need to roll 3 ones. The largest possible sum is 18, coming from three sixes. It's hard to get the extremes with three dice, the chances of rolling three ones is 1/6 * 1/6 * 1/6, or 1/216. The chances of rolling three sixes is also 1/216. On the other hand, by looking at the chart, you can infer there are many ways to roll a sum of 10 or 11. This is the peak of the chart. The chances of each roll is 1/8, a.k.a 0.125. The chances of summing to either 10 or 11 is 1/8 + 1/8 = 1/4, which is 0.25.

Once again, it's important to consider the shape of the chart. It's not flat. Nor is it as triangular as it was before. It's starting to look more like a curve. Keep watching the shape as we move on to four dice and five dice.
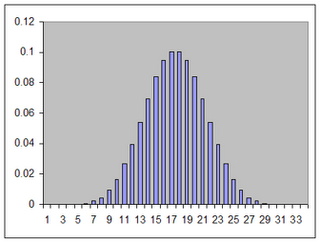
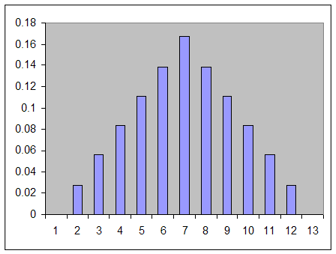
The next chart shows the sums possible with four dice. The lowest possible sum is now four (1+1+1+1), and the highest possible sum is twenty-four (6+6+6+6). The chances of getting either is 1/6 * 1/6 * 1/6 * 1/6, or 1/1296. Now the most likely sum is fourteen, the chances of which are just a little better than 1/10.
If you're thinking that the chart is starting to look like a bell curve, that's exactly what you should be thinking. This is one of the most important things to realize in this example.
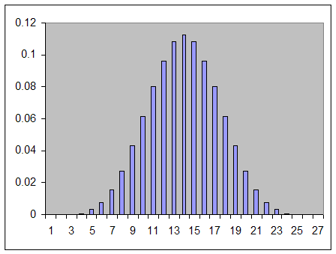
Finally, take a look at the case of five dice. Now the smallest possible sum is five (1+1+1+1+1). The largest possible sum is thirty (5+5+5+5+5). The chances of rolling either is 1/6 * 1/6 * 1/6 * 1/6 * 1/6, which amounts to 1/7776. This is also why people who have played Yahtzee scream when they roll five sixes on the first roll. It's like winning a miniature lottery, quite unlikely.
At the point of five dice, the shape of the chart really looks like a bell curve. The more dice we add, the better this definition gets. Also, the more dice we add to our equation, the harder it is to get to the extremes of all ones or all sixes (this fact is worthy of an extra thought or two), because it's 1/6 to get the first one, 1/6 to get the second one, 1/6 to get the third one, and so on.
There many names for the bell curve. Engineers tend to call it the Gaussian Curve. Statisticians call it the Normal Distribution. An amazing thing about it, is you always get this sort of curve when you sum up random things. The random things don't even have to be of the same kind of things; had we used a combination of six-sided and seven-sided (or whatever-sided) dice or even counted heads and tails of coin flips, we still would have wound up with a bell curve (slightly wider or taller, perhaps, but still a bell curve).
A profound implication is that there's a certain order that arises from randomness. People often scream "Entropy!" and assume more and more randomness produces greater and greater chaos, but it's not true (at least in the sense I mean here*). More and more randomness tends to make our conception of normal possible.
The thought of randomness making normal possible is counterintuitive. Shouldn't more randomness produce greater chaos*? Nope. Why? Because when you combine all sorts of random forces, many of them tend to counteract each other. The name for this phenomenon is the Central Limit Theorem.
For every six increasing the sum of your dice, there's a good chance there's a one decreasing it. You only wind up at the extremes when all of the random forces are going in the same direction with respect to the center, which isn't very likely for the same reason it's hard to roll all ones or all sixes.
Countless phenomena in the real world are the result of summing random factors, whether it's the shuffling of the genes that contribute to how tall we are or measurement errors made by astronomers. This is why the Normal Distribution is so common, and it's why the related statistical tools and methods are so useful and important.
"I know of scarcely anything so apt to impress the imagination as the wonderful form of cosmic order expressed by the 'Law of Frequency of Error.' The law would have been personified by the Greeks and deified, if they had known it. It reigns with serenity and in complete self-effacement amidst the wildest of confusion." -- Sir Francis Galton (1889)
For more information, research Central Limit Theorem and Normal Distribution.
(*This is the wrong place to go into the Shannon entropy of the Gaussian!)
As a parent who spends too much time on the road, I often find myself thinking about good examples to offer my children, in hopes of sparing them painful paths from "I don't get it!" to "Why didn't you say so?!?!" As a stab (no promises) toward such an end, I'm writing this post.
In order to understand most things, I think you have to get your empirical hands dirty. I think it's hard to gain real understanding working purely in abstract terms (if you can avoid it). The way to get your hands dirty in this particular case is by playing Yahtzee, a game I believe most people have played at one time or another in their lives.
Yahtzee consists of 5 dice. After rolling the dice, one attempts to fulfill one of several possible objectives, most of which resemble poker hands (four of a kind, three of a kind, a full house, etc.) If you've played Yahtzee, you know that the most pleasing rolls are those that reveal the most sixes, because there are a number of objectives best fulfilled with lots of sixes.
Here's a chart showing the chances of rolling 1, 2, 3, 4, 5 and 6 with a single die. If the die is fair and properly designed, the chance of each number is 1/6 (or 0.166666...). Notice that the chart is flat, which outcomes all numbers are equally likely.

Let's look at the possible sums resulting from rolling two dice. The two least likely sums are two and twelve. The reason is there's only one way to get those sums--you have to roll either 2 ones or 2 sixes. The chances of rolling either sum is 1/6 * 1/6, or 1/36. On the other hand, rolling a sum of seven is much easier, because there are so many combinations that add up to seven (1+6, 6+1, 2+5, 5+2, 3+4, 4+3).
It's important to consider the shape of the chart going from one die to the sum of two dice. The first chart was flat, with all outcomes equally probable. The second chart looks like a tent; it's triangular, high in the middle where sums are most likely and short at each end where sums are least likely.
Let's move on to three dice. Again, we'll look at the possible sums of all dice and the odds of getting those sums. The smallest possible sum is 3. To get it, you need to roll 3 ones. The largest possible sum is 18, coming from three sixes. It's hard to get the extremes with three dice, the chances of rolling three ones is 1/6 * 1/6 * 1/6, or 1/216. The chances of rolling three sixes is also 1/216. On the other hand, by looking at the chart, you can infer there are many ways to roll a sum of 10 or 11. This is the peak of the chart. The chances of each roll is 1/8, a.k.a 0.125. The chances of summing to either 10 or 11 is 1/8 + 1/8 = 1/4, which is 0.25.

Once again, it's important to consider the shape of the chart. It's not flat. Nor is it as triangular as it was before. It's starting to look more like a curve. Keep watching the shape as we move on to four dice and five dice.
The next chart shows the sums possible with four dice. The lowest possible sum is now four (1+1+1+1), and the highest possible sum is twenty-four (6+6+6+6). The chances of getting either is 1/6 * 1/6 * 1/6 * 1/6, or 1/1296. Now the most likely sum is fourteen, the chances of which are just a little better than 1/10.
If you're thinking that the chart is starting to look like a bell curve, that's exactly what you should be thinking. This is one of the most important things to realize in this example.
Finally, take a look at the case of five dice. Now the smallest possible sum is five (1+1+1+1+1). The largest possible sum is thirty (5+5+5+5+5). The chances of rolling either is 1/6 * 1/6 * 1/6 * 1/6 * 1/6, which amounts to 1/7776. This is also why people who have played Yahtzee scream when they roll five sixes on the first roll. It's like winning a miniature lottery, quite unlikely.

At the point of five dice, the shape of the chart really looks like a bell curve. The more dice we add, the better this definition gets. Also, the more dice we add to our equation, the harder it is to get to the extremes of all ones or all sixes (this fact is worthy of an extra thought or two), because it's 1/6 to get the first one, 1/6 to get the second one, 1/6 to get the third one, and so on.
There many names for the bell curve. Engineers tend to call it the Gaussian Curve. Statisticians call it the Normal Distribution. An amazing thing about it, is you always get this sort of curve when you sum up random things. The random things don't even have to be of the same kind of things; had we used a combination of six-sided and seven-sided (or whatever-sided) dice or even counted heads and tails of coin flips, we still would have wound up with a bell curve (slightly wider or taller, perhaps, but still a bell curve).
A profound implication is that there's a certain order that arises from randomness. People often scream "Entropy!" and assume more and more randomness produces greater and greater chaos, but it's not true (at least in the sense I mean here*). More and more randomness tends to make our conception of normal possible.
The thought of randomness making normal possible is counterintuitive. Shouldn't more randomness produce greater chaos*? Nope. Why? Because when you combine all sorts of random forces, many of them tend to counteract each other. The name for this phenomenon is the Central Limit Theorem.
For every six increasing the sum of your dice, there's a good chance there's a one decreasing it. You only wind up at the extremes when all of the random forces are going in the same direction with respect to the center, which isn't very likely for the same reason it's hard to roll all ones or all sixes.
Countless phenomena in the real world are the result of summing random factors, whether it's the shuffling of the genes that contribute to how tall we are or measurement errors made by astronomers. This is why the Normal Distribution is so common, and it's why the related statistical tools and methods are so useful and important.
"I know of scarcely anything so apt to impress the imagination as the wonderful form of cosmic order expressed by the 'Law of Frequency of Error.' The law would have been personified by the Greeks and deified, if they had known it. It reigns with serenity and in complete self-effacement amidst the wildest of confusion." -- Sir Francis Galton (1889)
For more information, research Central Limit Theorem and Normal Distribution.
(*This is the wrong place to go into the Shannon entropy of the Gaussian!)
posted by metamerist at
7:56 AM
![]()

1 Comments:
Great post! Sweet that you’re motivated by wanting to explain things clearly to your kids! :-) One typo though, 5+5+5+5+5 is 25, not thirty.
Post a Comment
Subscribe to Post Comments [Atom]
<< Home